Don’t Risk It!

Trajectory-Conditioned Distributional Risk for LiDAR-Only Crowd Navigation

Anonymous submission

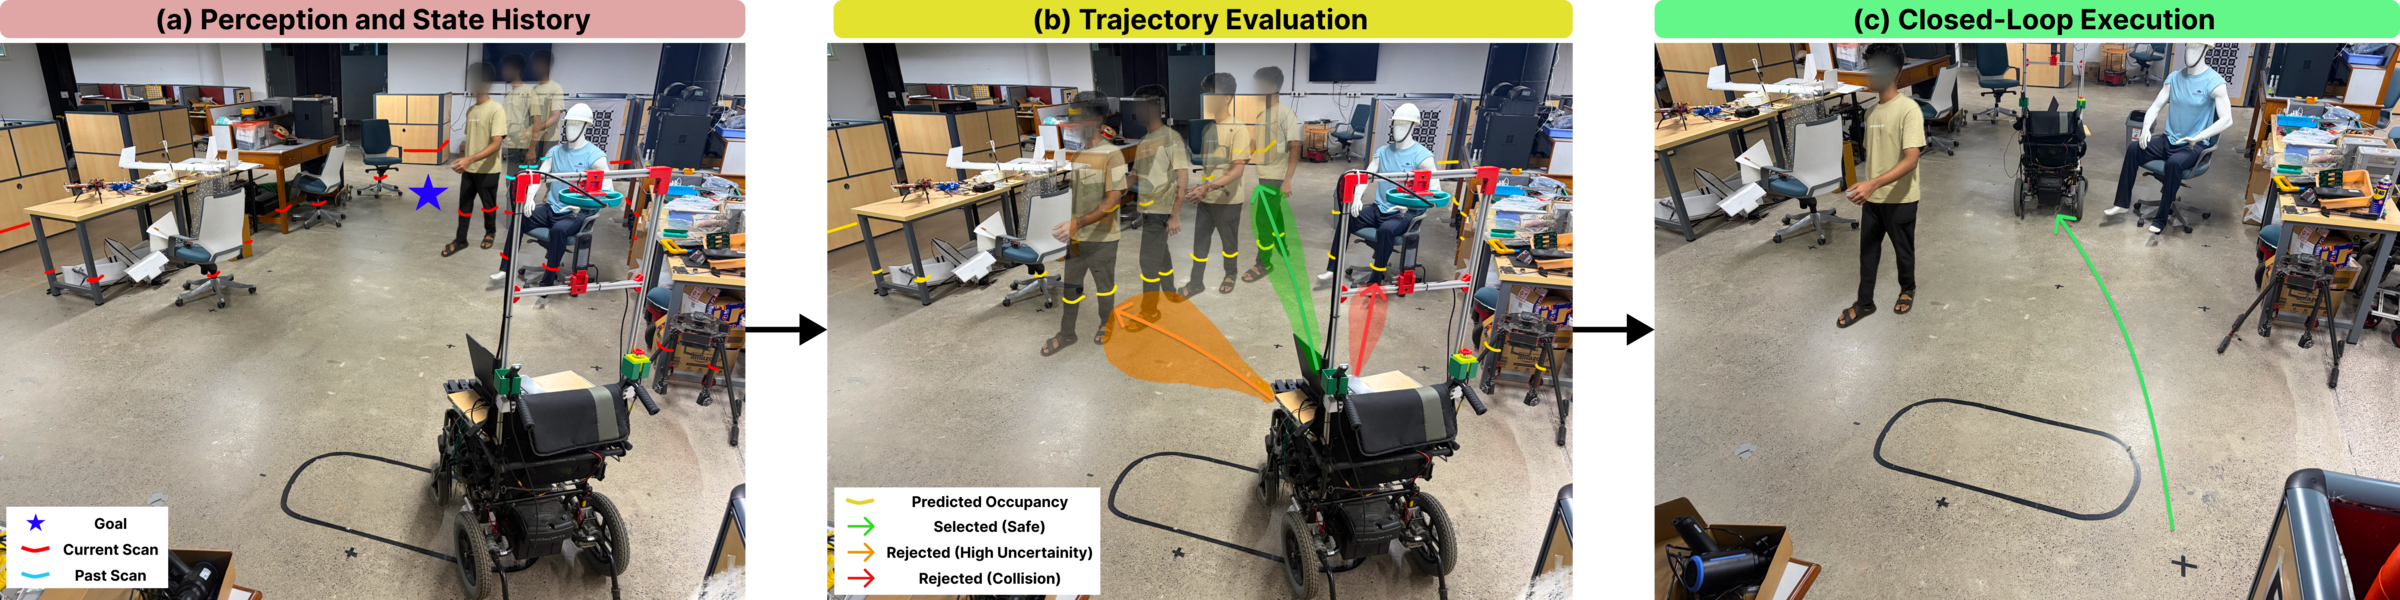
Navigation via trajectory-conditioned distributional risk: (a) LiDAR history and goal, (b) candidate rollouts shaded by predictive uncertainty and coloured as selected, rejected for high uncertainty or rejected for collision, (c) the wheelchair executing the selected trajectory around a pedestrian.

Navigation via trajectory-conditioned distributional risk. (a) From a 1 s history of raw 2D LiDAR grids, with no object detection or pedestrian tracking, the model forecasts how the scene will evolve. (b) Candidate rollouts are shaded by their predictive variance envelopes: maneuvers that collide with static obstacles are discarded (red), paths that cut across the pedestrian’s anticipated path incur an elevated risk penalty (orange), and the wide bypass keeps a tight predictive distribution and is certified safe (green). (c) The autonomous wheelchair executes the selected control sequence and passes the moving pedestrian.

Abstract

Efficient crowd navigation requires anticipating dynamic collision-free space without relying on fragile object tracking. We propose the Don’t Risk It Planner (DRIP), an end-to-end LiDAR-only planning framework that couples occupancy forecasting with trajectory-conditioned clearance and uncertainty estimation. Operating directly on LiDAR-derived occupancy grid histories, DRIP predicts a distribution over minimum robot–obstacle clearance for candidate control sequences to evaluate collision risk. The model is trained using a risk cost that grounds predictive uncertainty directly in empirical collision outcomes rather than geometric regression alone. In closed-loop experiments with up to 45 pedestrians, DRIP achieves higher success rates with fewer collisions and reduced freezing behavior compared to state-of-the-art baselines.

Video

Method

Prediction errors matter differently depending on the trajectory under consideration: an occupancy error far from the robot’s path may be irrelevant, whereas a small error near its closest encounter with an obstacle can change whether the trajectory should be chosen. DRIP therefore assesses each candidate through its distributional collision risk. A distribution over the minimum clearance along the trajectory is predicted from the LiDAR history, and the extent to which this distribution violates the required safety buffer is quantified as a single risk value.

  • LiDAR-only predictive planning. Detection- and tracking-free occupancy forecasting is coupled with a trajectory-conditioned distribution over minimum clearance, which is mapped to collision risk with a squared-MMD functional.
  • Risk-calibrated uncertainty learning. Supervision from safe and unsafe trajectories shapes the predictive variance through its downstream effect on the risk estimate, rather than through scene-level forecasting accuracy alone.
  • Sampling-based planning. The risk, a next-step occupancy check, goal progress and smoothness are combined in a DWA-style local planner that replans at 10 Hz.
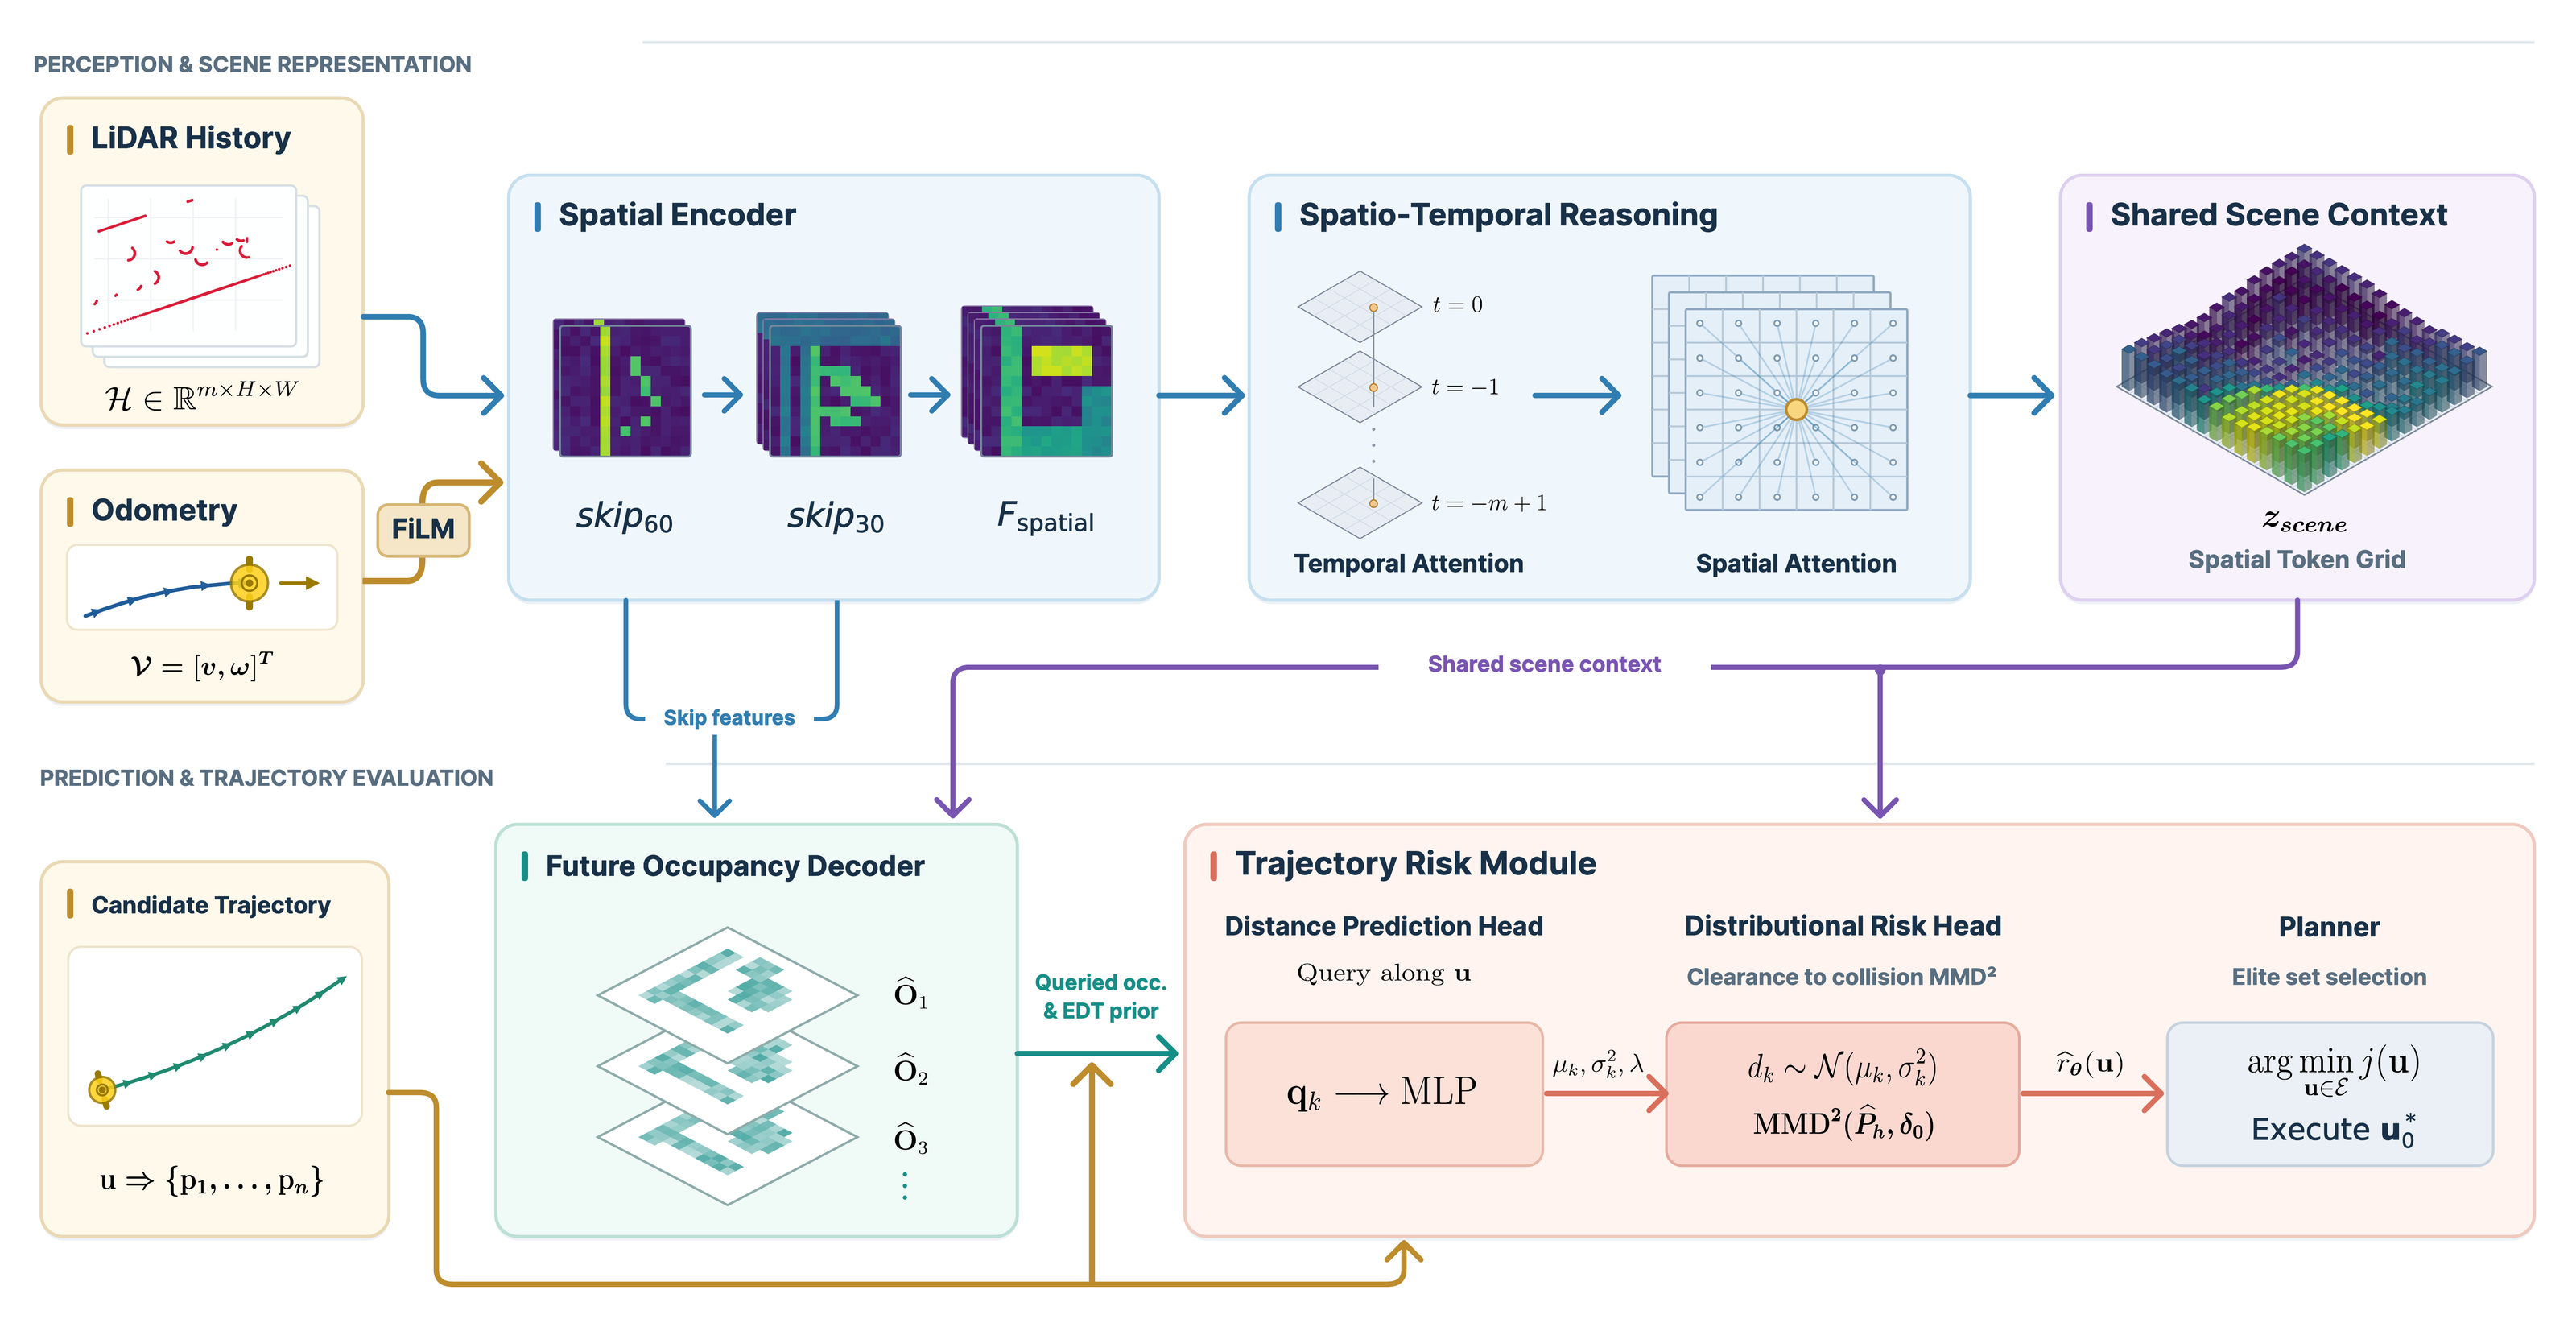
DRIP architecture: a history of pose-warped BEV occupancy maps is encoded by a shared spatial CNN with FiLM conditioning on ego velocity, spatiotemporal transformer blocks produce a scene representation, an occupancy decoder forecasts future occupancy and a trajectory-conditioned distance head predicts a clearance distribution and kernel width used to compute the MMD risk.

Overview of DRIP’s LiDAR-only prediction and trajectory-conditioned risk architecture. A history $\mathcal{H}$ of pose-warped BEV occupancy maps is encoded independently by a shared-weight spatial CNN, conditioned on ego velocity $\mathcal{V}$ through FiLM. Spatiotemporal Transformer blocks then reason over the temporal history and spatial BEV tokens to produce a shared scene representation $z_{scene}$. Two branches use this representation: the occupancy decoder predicts the future evolution of the scene ($\widehat{\mathbf{O}}_k$) over a 20-step horizon, while the trajectory-conditioned Distance Head combines scene features with candidate trajectory queries $\mathbf{q}_k$ to predict a stepwise clearance distribution $(\mu_k,\sigma_k^2)$ and a trajectory-specific kernel width $\lambda$. These predictions are subsequently used to compute the distributional $\mathrm{MMD}^2$ risk $\widehat{r}_{\boldsymbol{\theta}}(\mathbf{u})$ for each candidate trajectory $\mathbf{u}$.

Qualitative Comparisons

Closed-loop navigation in simulated dense crowds, in the same scene for both planners.

Real-World Deployment

We deploy DRIP on two platforms with different form factors and sensing: a Pioneer 3-DX with a 2D RPLIDAR A3, and a full-scale autonomous wheelchair with a Livox Mid-360 3D LiDAR whose returns are filtered, ground-segmented and projected into 2D BEV occupancy grids. The whole perception and planning pipeline runs onboard.

Across 20 closed-loop trials (paths of 15–35 m) in a cluttered laboratory space and an academic corridor, with unscripted humans as dynamic obstacles, DRIP succeeds in 17 of 20 runs (85%) without human intervention. In open corridors it commits to wide bypasses well before mutual deceleration; in tight bottlenecks the clearance floor keeps the base off the walls while the learned risk moderates speed through moving crowds, avoiding freezing.

Tracking-Free Occupancy Prediction

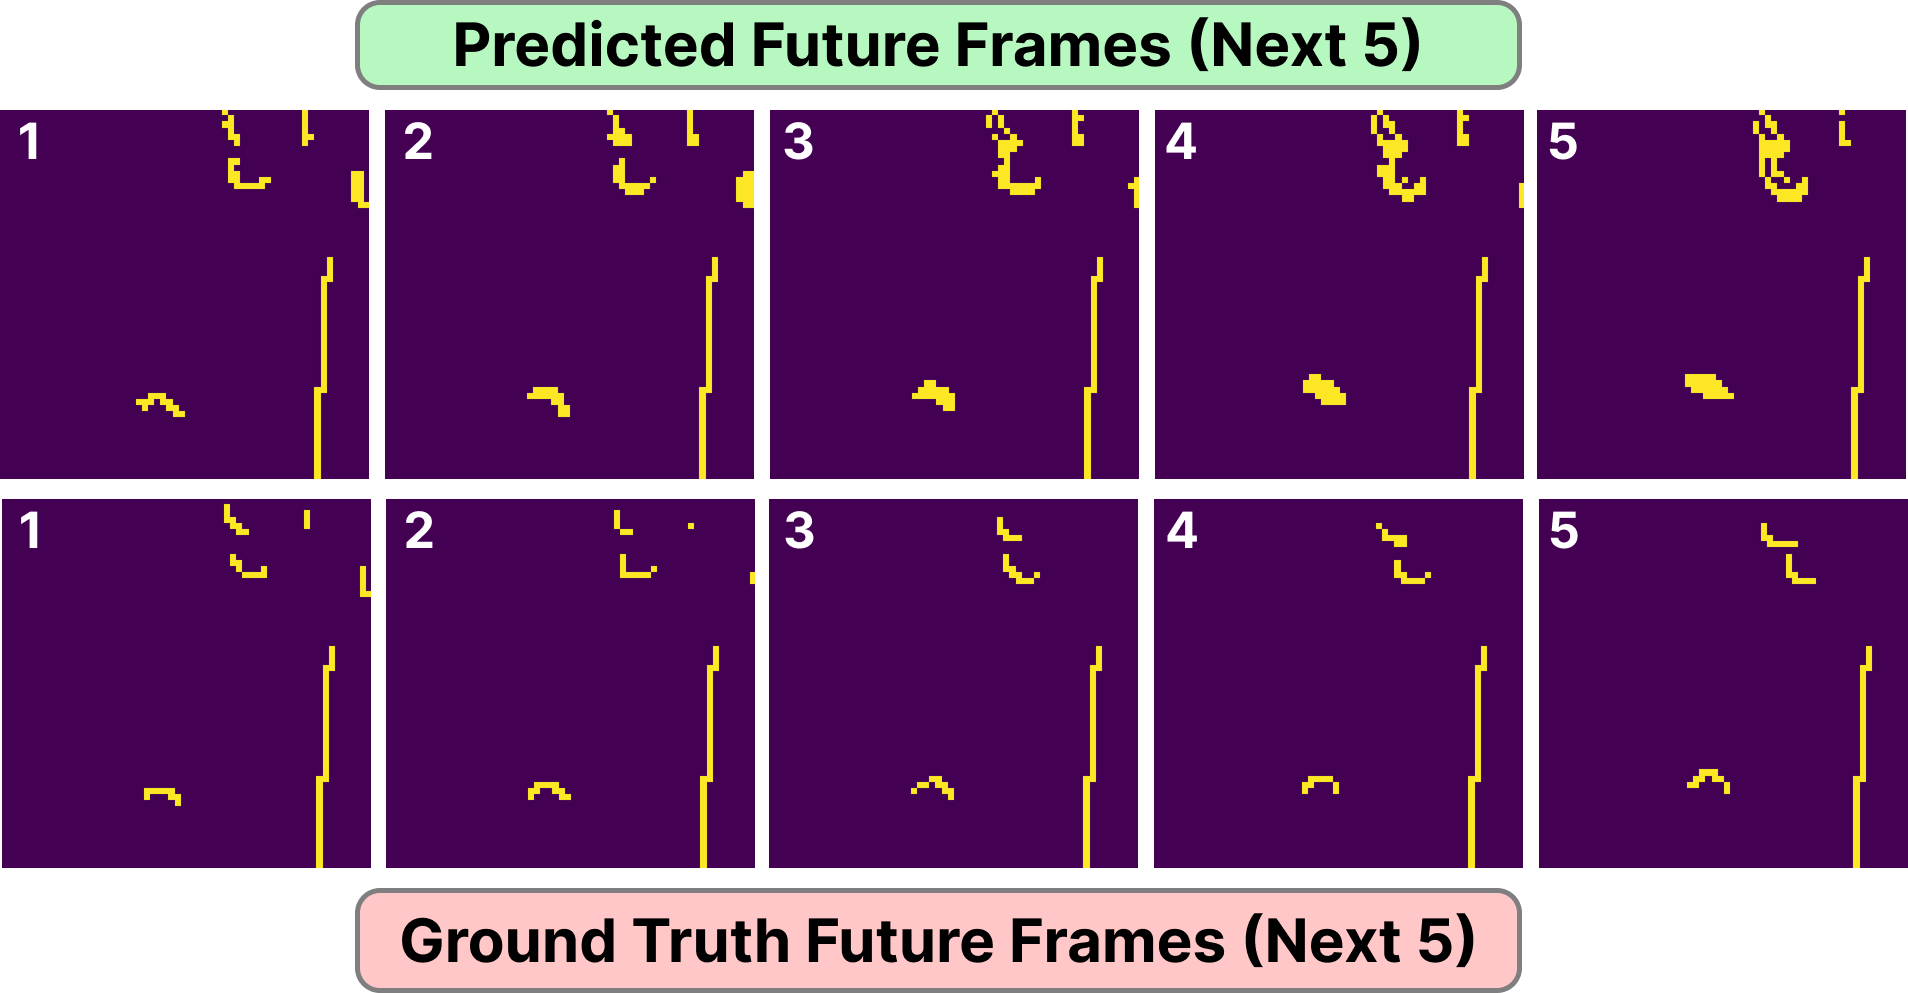
Predicted future occupancy maps (top row) against ground-truth future occupancy maps (bottom row) for the first five forecast steps.

Top row: the first five steps of the predicted future occupancy maps ($\widehat{\mathbf{O}}_k$), thresholded, from the full 20-step horizon. Bottom row: the corresponding ground-truth maps ($\mathbf{O}_k^{\mathrm{gt}}$). From LiDAR histories alone, with no pedestrian tracking or data association, the network anticipates the motion of dynamic obstacles while preserving static boundaries.

Simulation Benchmarks

We evaluate in the PedSim simulator (Lobby world) with a differential-drive Turtlebot2 and a 270° 2D LiDAR, against DWA, TEB, SCOPE and DRL-VO, with 35 and 45 active pedestrians (100 nominal runs each) and with Gaussian LiDAR range noise of $\sigma = 0.05\,\mathrm{m}$ (50 runs each). A run succeeds if it reaches the goal without collision within 90 s. DRIP, DWA, TEB and SCOPE use raw 2D LiDAR only; DRL-VO† is given privileged pedestrian tracks and velocities, and is therefore not evaluated under noise.

Closed-loop evaluation in dense crowds. At 45 pedestrians DRIP reaches 85.0% success, and under sensor noise it holds 86.0% success at a completion time of 13.4 s versus 27.0 s for SCOPE.

Planner Nominal navigation (100 runs) Sensor noise, σ = 0.05 m (50 runs)
Succ. (%) ↑Time (s) ↓Path (m) ↓Vel. (m/s) ↑ Succ. (%) ↑Time (s) ↓Path (m) ↓Vel. (m/s) ↑
35 pedestrians
DRL-VO†74.011.55.390.460––––
DWA79.013.55.080.35538.031.87.330.195
SCOPE80.014.85.420.36566.026.36.100.227
TEB71.012.35.460.41330.040.218.090.368
Ours87.012.14.830.39482.012.94.670.357
45 pedestrians
DRL-VO†82.011.55.420.455––––
DWA74.014.75.470.35252.028.85.600.175
SCOPE78.015.25.090.32864.027.05.530.204
TEB76.012.55.380.41320.046.521.010.312
Ours85.013.04.820.37686.013.44.870.356

Best and second-best success rates are highlighted. †DRL-VO uses privileged pedestrian tracking and velocities and is excluded from the noise tests. The full decision loop (perception, forecasting, risk evaluation and planning) runs in about 70 ms on an RTX 3060 laptop GPU, inside the 100 ms budget of a 10 Hz control loop.

Additional environments. The same planners in two further simulated worlds, Autolab and Cumberland, under nominal navigation only (no noise runs).

Planner Succ. (%) ↑Time (s) ↓Path (m) ↓Vel. (m/s) ↑
Autolab — 30 pedestrians (30 runs)
DWA66.716.75.670.325
SCOPE83.318.15.900.322
TEB70.013.35.820.424
Ours86.712.75.500.419
Cumberland — 28 pedestrians (30 runs)
DWA63.327.67.390.314
SCOPE76.715.25.470.366
TEB76.712.85.830.434
Ours83.316.97.280.399

Best and second-best success rates are highlighted; SCOPE and TEB tie for second in Cumberland.